Accelerated Stress Testing (AST) Protocols for Heavy-Duty Fuel Cells
BACKGROUND
One of the most pressing technical challenges in fuel-cell research and development of HDVs is the greater demand for durability, with over 5x improvements in the lifetime to achieve the M2FCT goal of 1 million miles (1.6 million km). Overcoming this challenge requires not only the design and interrogation of robust materials for more durable cells, but also the durability protocol development and lifetime prediction models to guide the material and cell design. An essential aspect of durability efforts for fuel cells is the development of Accelerated Stress Testing (AST) for Heavy-Duty Fuel Cells, which is one of the focus areas and milestones in the M2FCT consortium. To realize this goal effectively and to expedite the research output, M2FCT has formed an AST working group (ASTWG) in 2021 with the objective of defining the 25,000-hour equivalent AST in the M2FCT 2025 Target.
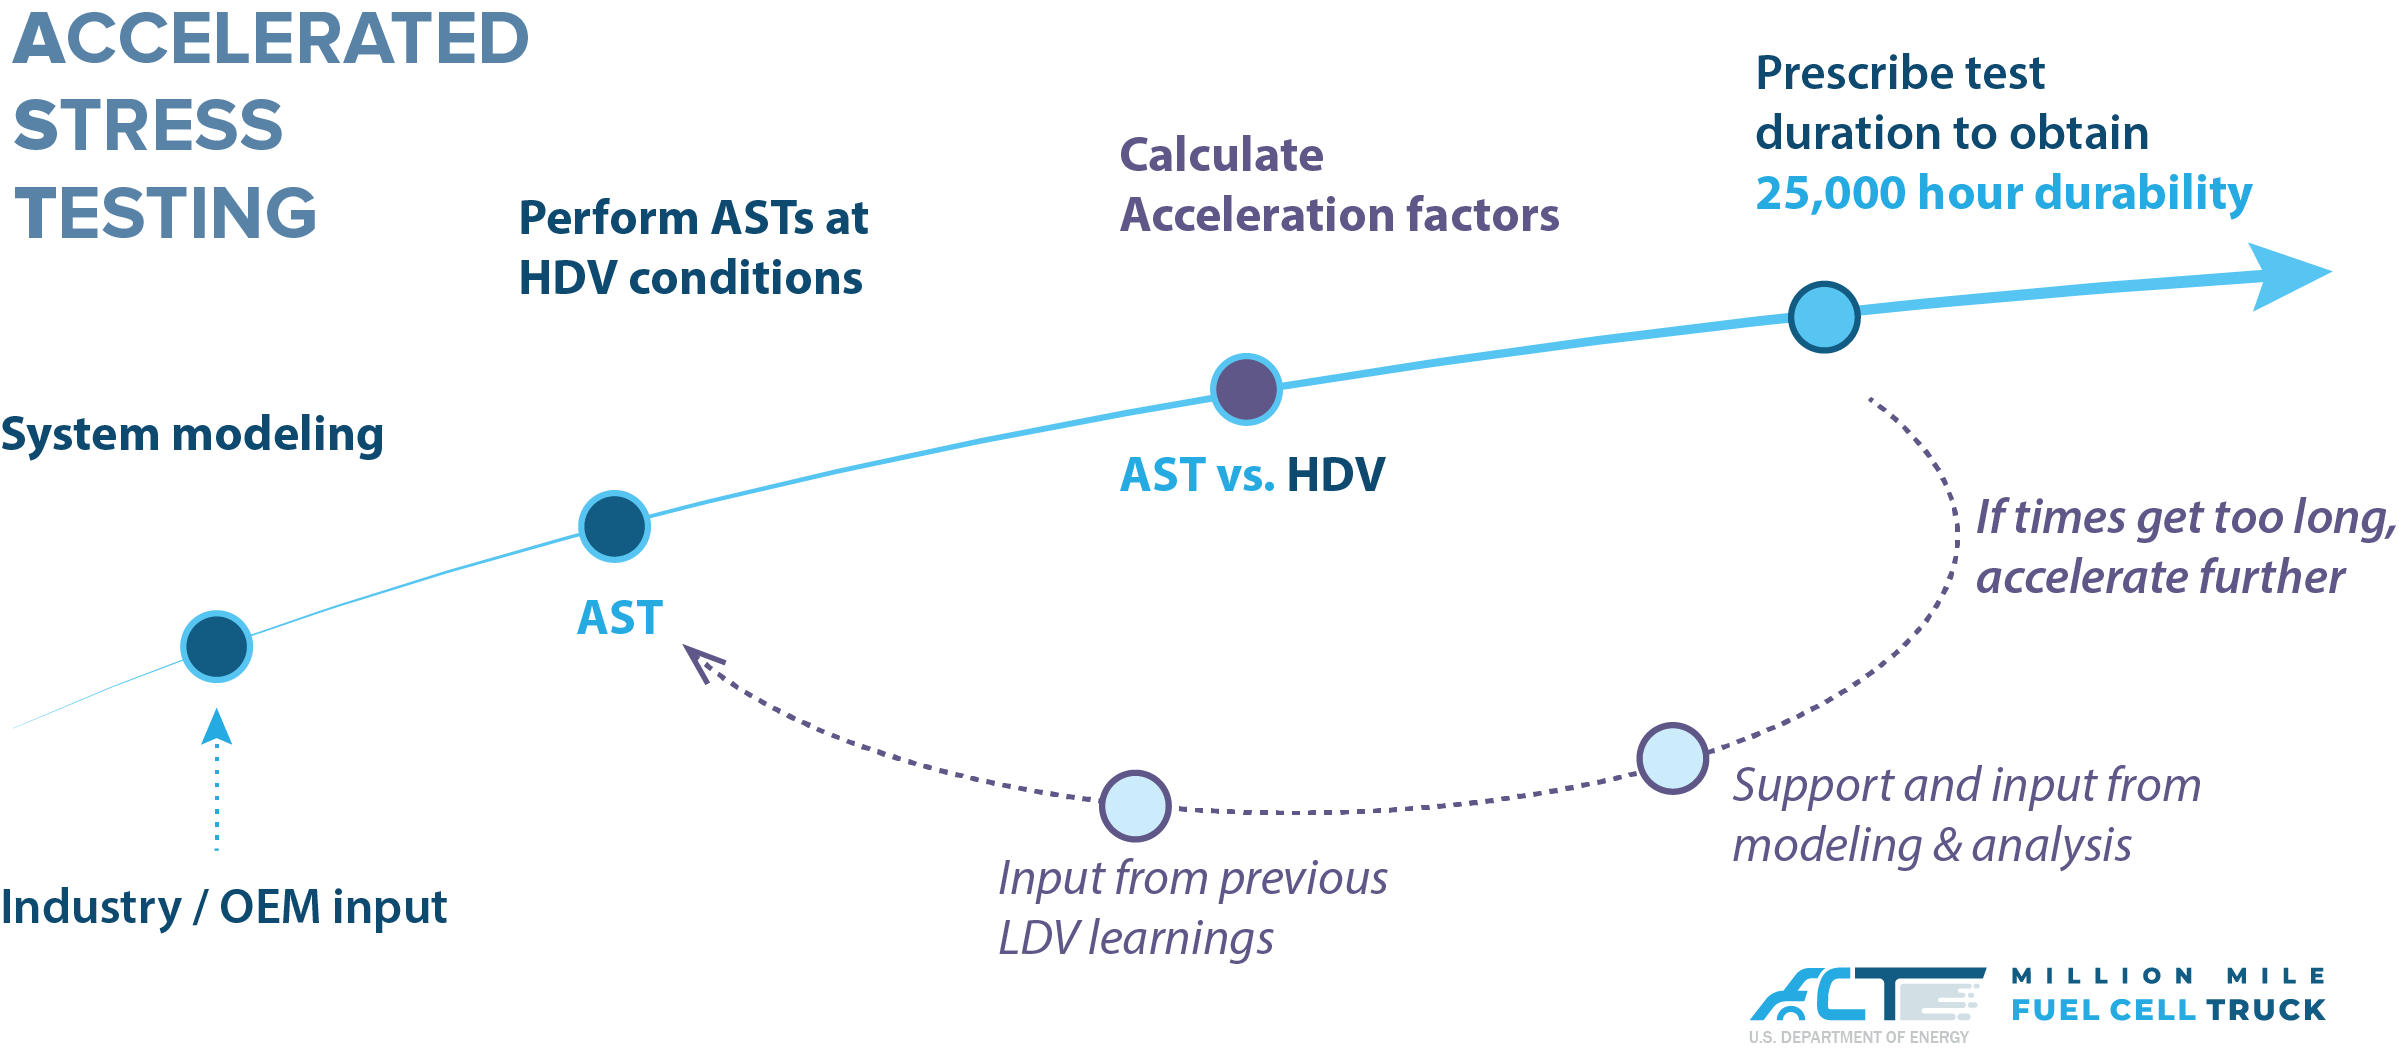
We have worked closely with the interested stakeholders, received input from the 21st Century Truck Partnership on real drive cycles, evaluated the representative stressors, and developed a protocol for AST of HDV fuel cells.
M2FCT (Million Mile Fuel Cell Truck) consortium has recently published an MEA (Membrane Electrode Assembly) AST (Accelerated Stress Test) protocol. This protocol still needs validation and approval by the Fuel Cell Joint Tech Team.
M2FCT plans to run this protocol on various MEAs this year to understand the degradation rates of SOA (State of the Art) materials under this protocol. The protocol will be updated (If needed) by the end of the Fiscal year. Please contact us at M2FCTSC@lbl.gov if you have any comments.
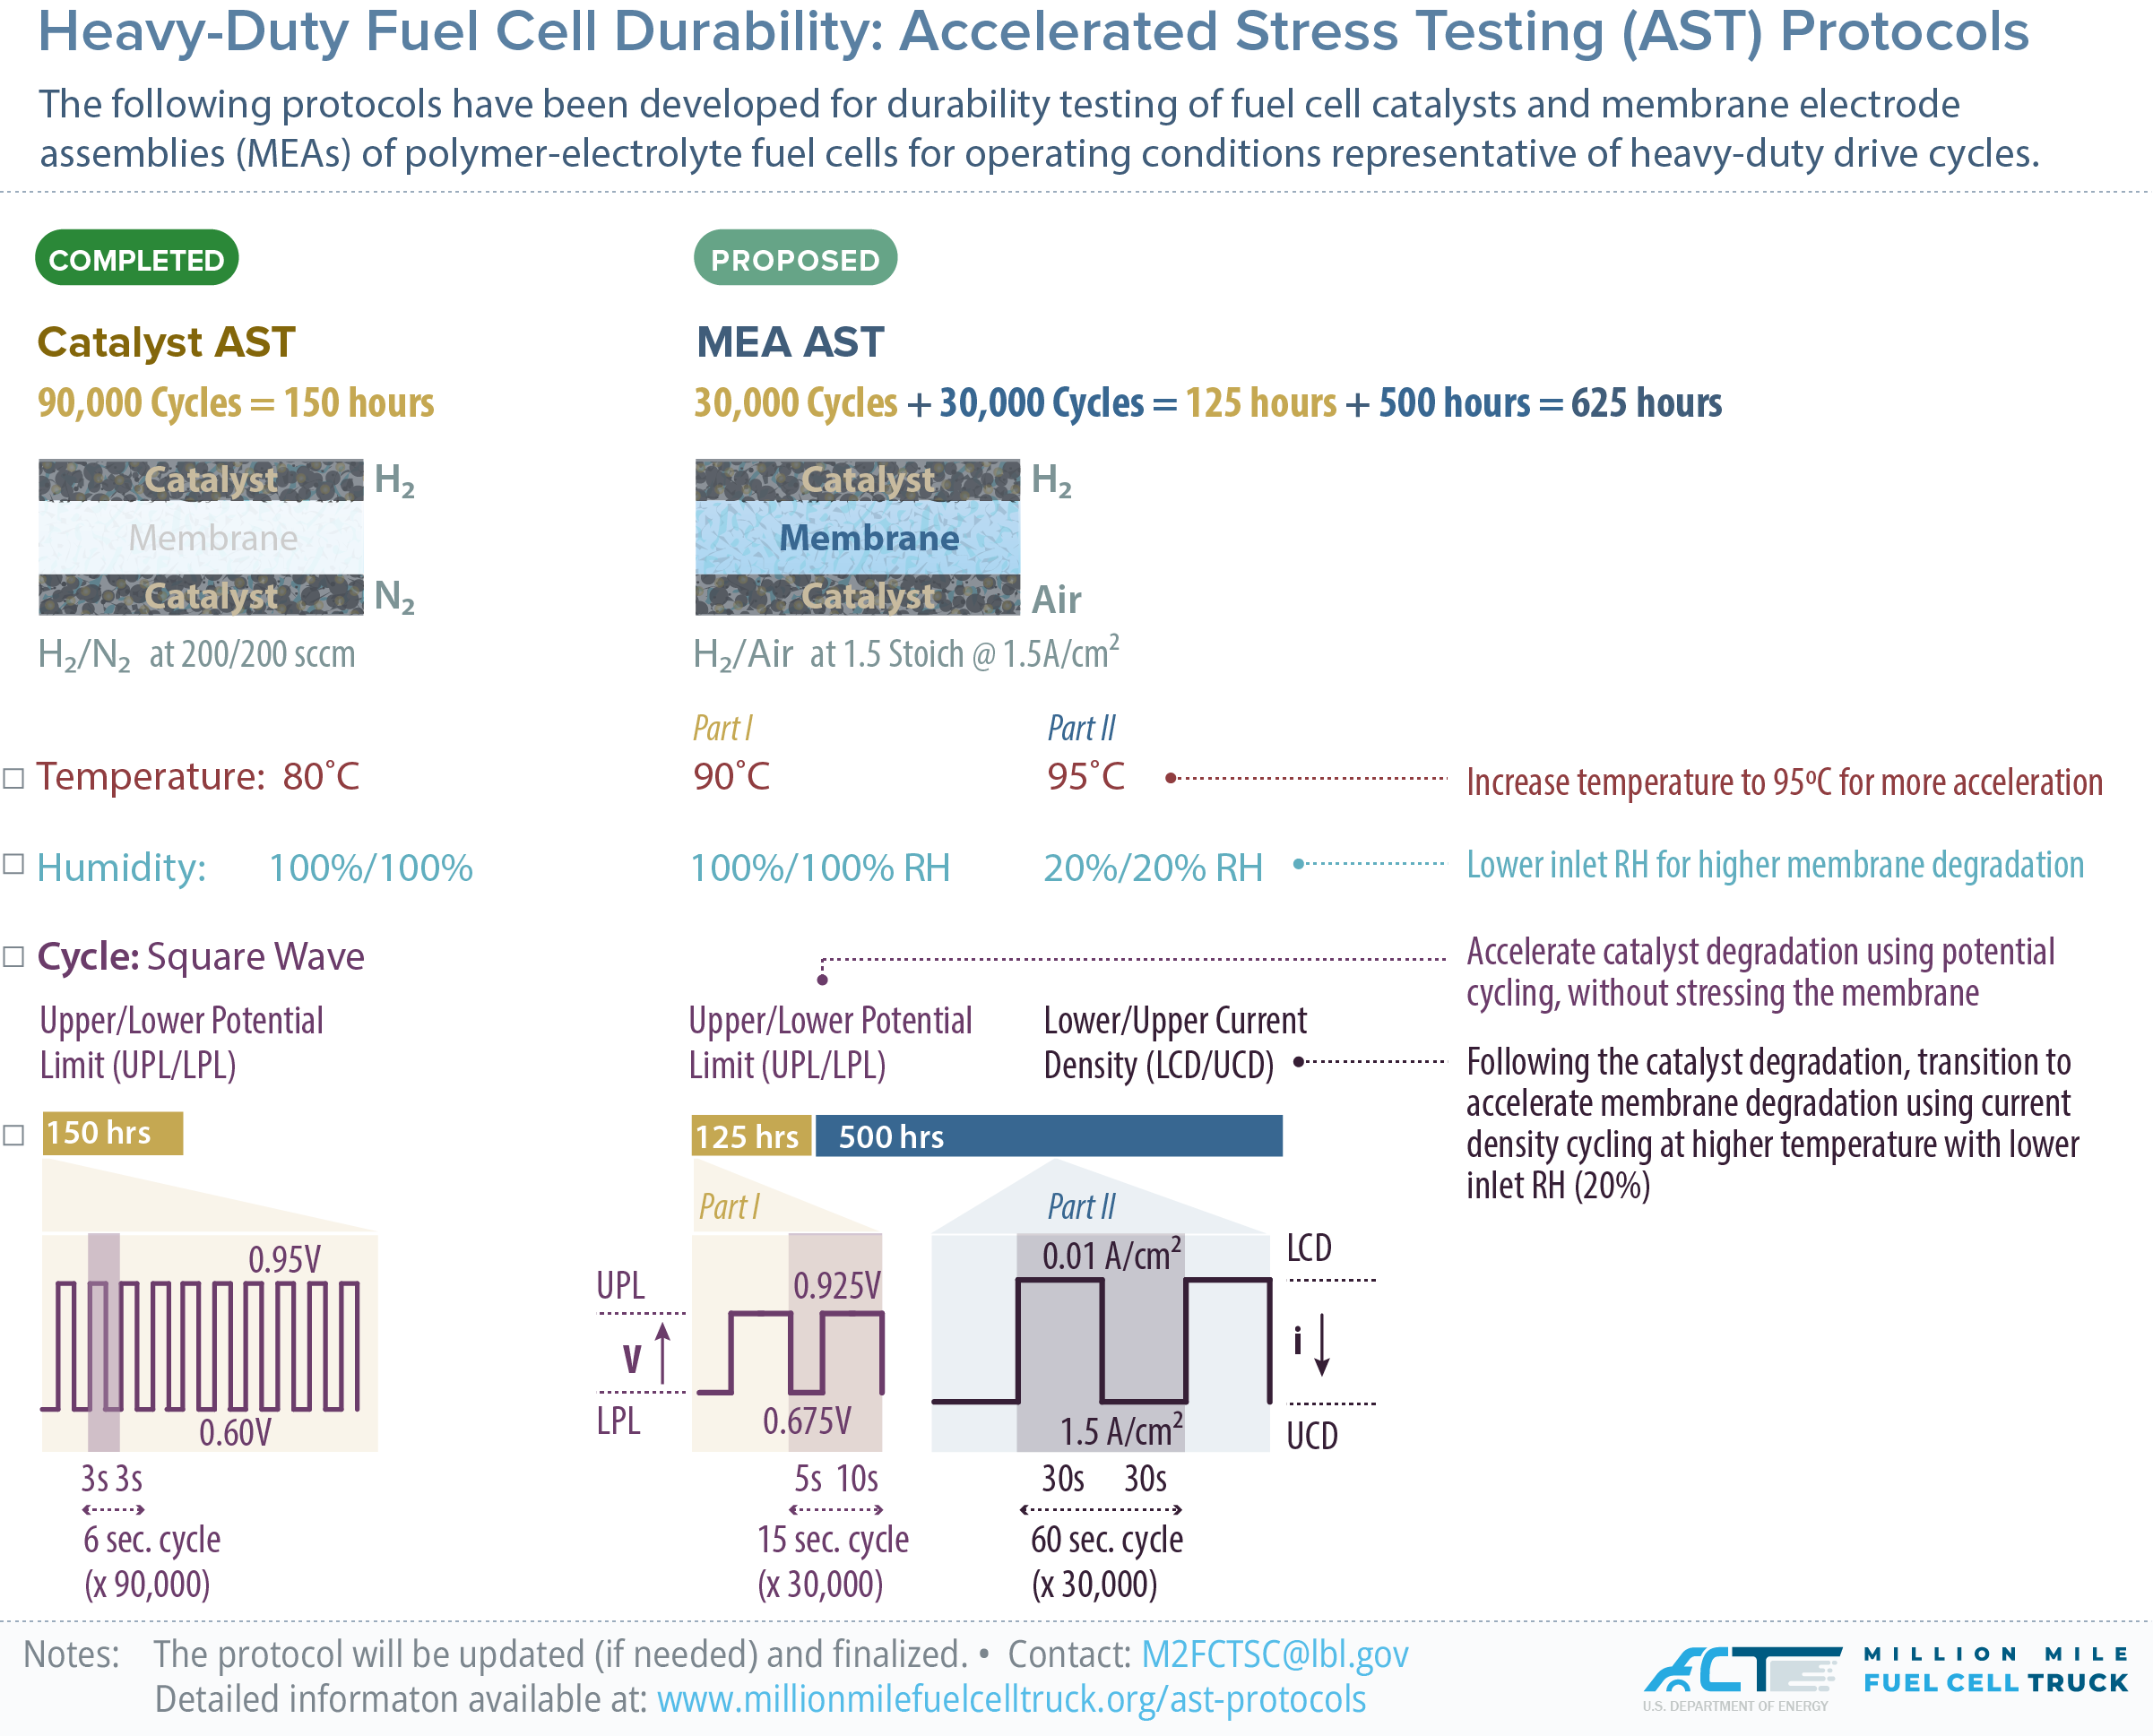
Heavy-Duty Fuel Cell Catalyst AST Protocol:
PROTOCOL: Heavy Duty Electrocatalyst Cycle and Metrics for 5 and 50 cm2 Cells
| Cycle |
Square wave cycle: steps between 0.6 V (3 s) and 0.95 V (3 s) with rise time of ~0.5 s or less; run polarization curve and ECSA at specified intervals.a,b
|
|---|---|
| Number | 90,000 cycles |
| Cycle time | 6 seconds |
| Temperature | 80oC |
| Relative Humidity | Anode/Cathode: 100%/100% |
| Fuel/Oxidant | Hydrogen/N2 (200/200 sccm) |
| Pressure | Atmospheric pressure (101.3 kPa) |
METRICS
| Metric | Frequency | Target |
|---|---|---|
| Catalytic Mass Activity c | At BOT,d and End of Test (EOT) minimum | N/A |
| ECSA/Cyclic Voltammetry e | At BOT, after 30k, 60k, 90k cycles | < 40% loss of initial area |
| Polarization curve from 0 to >1.5 A/cm2 f,g | At BOT, after 30k, 60k, 90k cycles | < 30mV loss at 0.8 A/cm2 |
NOTES
a. 5 cm2 cell based on a 14-channel serpentine cell (D.R. Baker et al. 2009 J. Electrochem. Soc. 156 B991) operated under
co-flow conditions.
b. 50 cm2 cell operated in counterflow.
c. Mass activity in A/mg @ 150 kPa abs backpressure at 900 mV iR-corrected on H2/O2, 100% RH, 80°C, anode stoichiometry 2; cathode stoichiometry 9.5 (as per Gasteiger et al. Applied Catalysis B: Environmental, 56 (2005) 9-35). The measured ORR current should be corrected for H2 crossover and shorting.
d. BOT measured after a conditioning protocol comparable to the one reported by Kabir et al. 2019 ACS Appl.Mater. Interfaces 11, 45016.
e. This can be from HUPD sweeping from 0.05 to 1.0 V at 20 mV/s, 30°C, >100% RH or optimal condition based on electrode size/loading. ECSA from CO stripping is necessary for alloy electrocatalysts.
f. 50 cm2 cells - H2/Air, 250 kPa abs backpressure, 90°C, 40% RH, cathode stoichiometry 1.5, anode stoichiometry 2. 0.25(cath)/0.05(an) mg/cm2 maximum PGM loading. Recommend taking pol curves from high to low current densities at 0.01, 0.02, 0.03, 0.05, 0.1, 0.2, 0.4, 0.6, 0.8, 1, 1.25, 1.5, 2 A/cm2 etc. as needed/obtainable above 0.2 V cell voltage, 240s hold time at each data point 1, 1.25, 1.5, 1.5 and 2 A/cm2, 240s hold time at each data point
g. 5 cm2 cells - H2/Air, 250 kPa abs backpressure, 90°C, 85% RH, 15%O 2 1/3 SLPM H2/15% O2 ; 0.25(cath)/0.05(an) mg/cm2 maximum PGM loading Recommend taking pol curves from high to low current densities at 0.01, 0.02, 0.03, 0.05, 0.1, 0.2, 0.4, 0.6, 0.8, 1, 1.25, 1.5, 1.5 and 2 A/cm2, as needed/obtainable above 0.2 V cell voltage, 240s hold time at each data point
Heavy-Duty MEA AST Protocol:
PROTOCOL
| Cycle |
Part 1: Square wave between 0.675 V (5s) and 0.925 V (10s)a Single-cell 50 cm2 |
|
|---|---|---|
| Number | Part 1: 125 hours or 30,000 cycles Part 2: 500 hours or 30,000 cycles |
|
| Cycle time | Part 1: 15 sec Part 2: 60 sec (1 minute) |
|
| Temperature | Part 1: 90oC Part 2: 95oC |
|
| Relative Humidity | Part 1: Anode/Cathode: 100%/100% Part 2: Anode/Cathode: 20%/20% |
|
| Fuel/Oxidant | Hydrogen/Air (at 1.5 stoichiometry @ 1.5A/cm2) | |
| Pressure | 250 kPa abs |
METRICS
| Metric | Frequency | Target |
|---|---|---|
| Catalytic Mass Activity c | At BOTd, after 25h, 50h, 75h, 100h, 125h, 225h, 325h, 425h, 525h and 625h |
TBD |
| ECSA/Cyclic Voltammetry e | At BOT, after 25h, 50h, 75h, 100h, 125h, 225h, 325h, 425h, 525h and 625h |
TBD |
| Hydrogen Crossover f | At BOT, after 25h, 50h, 75h, 100h, 125h, 225h, 325h, 425h, 525h and 625h |
TBD |
| Polarization Curve g | At BOT, after 25h, 50h, 75h, 100h, 125h, 225h, 325h, 425h, 525h and 625h |
TBD |
| Fluoride Emission Rate h |
Only for Part 2: After 225h 325h, 425h, 525h and 625h |
TBD |
NOTES
a. Ramp rate of 100 mV/s to avoid overshoot. A minimum of 2.5 s of LPL and 7.5 s of UPL holding time are required.
b. 14-channel serpentine cell (as reported in: D.R. Baker et al. (2009) J. Electrochem. Soc. 156 B991) operated under counter flow conditions.
c. Mass activity in [A/mg] @ 150 kPaabs backpressure at 900 mV iR-corrected on H2/O2, 100% RH, 80°C, anode stoichiometry 2; cathode stoichiometry 9.5, normalized to initial mass of catalyst and measured before and after test (as per Gasteiger et al. Applied Catalysis B: Environmental, 56 (2005) 9-35). The measured ORR current should be corrected for H2 crossover and shorting.
d. BOT measured after a conditioning protocol comparable to the one reported by: Kabir et al. (2019) ACS Appl. Mater. Interfaces 11, 45016.
e. Can be from HUPD sweeping from 0.05 to 1.0 V at 20 mV/s, 30°C, >100% RH or optimal condition based on electrode size/loading. ECSA from CO stripping is necessary for alloy electrocatalysts
f. Crossover measured at T = 80°C, RH = 100%, Pressure = 101.3 kPa, 2mV/s scan rate from 100 mV to 400 mV. H2 = 500 sccm, N2 = 500 sccm.
g. H2/Air, 250 kPaabs, 90°C, 40% RH, cathode stoichiometry 1.5, anode stoichiometry 2; Recommend taking pol curves from high to low current densities at 0.01, 0.02, 0.03, 0.05, 0.1, 0.2, 0.4, 0.6, 0.8, 1, 1.25, 1.5, 1.75 and 2 A/cm2, 240 s hold time at each data point.
h. Collect all the anode and cathode water separately during Part 2 of the test. Analyze the fluoride concentration of the water and calculate the total fluoride emission for each 100-hour (6000 cycles) test period. The fluoride concentration can be measured using the Ion Chromatography technique described in: Michael A. Yandrasits et al. (2022) J. Electrochem. Soc. 169 034526.
The protocol will be updated (if needed) by the end of the Fiscal year (September 2024).
Please contact us at M2FCTSC@lbl.gov if you have any comments.